'Tableau' 카테고리의 다른 글
| [Tableau] How Much Americans Spend on Holiday Every Year? (0) | 2023.01.11 |
|---|---|
| [Tableau] UK Religious Affiliation Dashboard (0) | 2023.01.05 |
| [Tableau] 텍스트 전처리 for Netflix Dashboard (0) | 2023.01.05 |
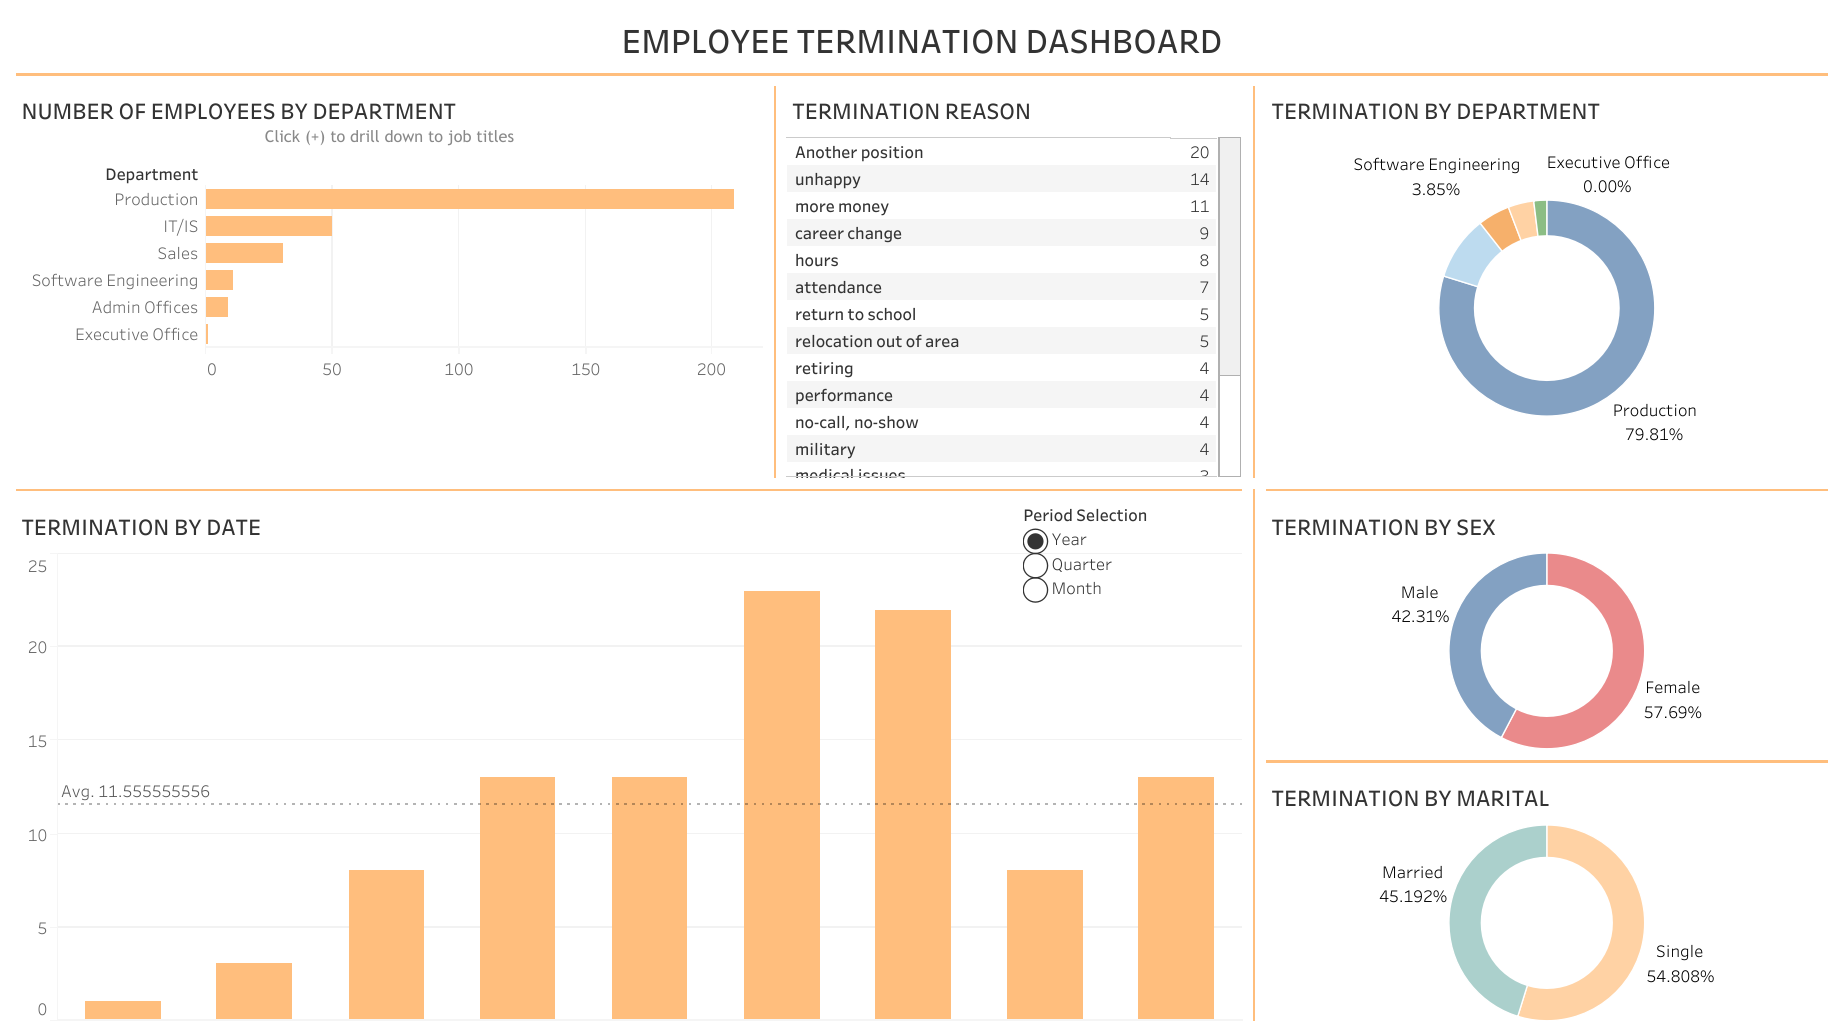
| [Tableau] HR Employee Termination Dashboard (0) | 2022.12.27 |
| [Tableau] HR Employment Equity Dashboard (0) | 2022.12.27 |