Graph2) 영업사원의 영업 관련 그래프
1. 시각화 목적:
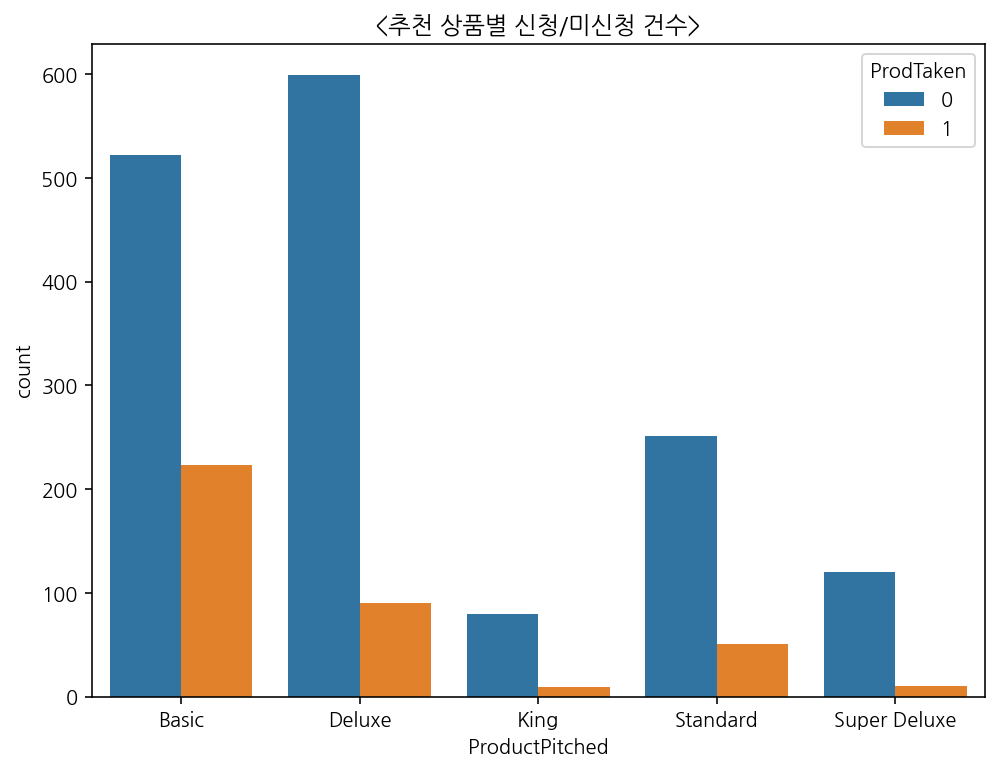
1) 영업사원의 프로모션이 얼마큼 효과가 있었는지 확인하기 위한 그래프
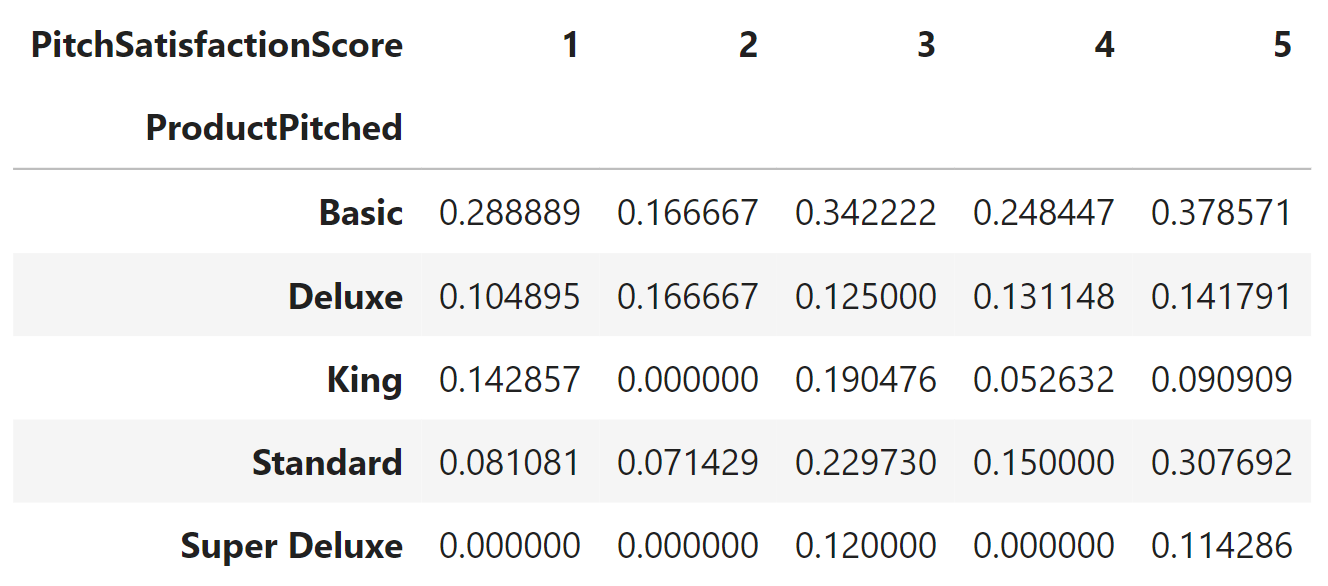
2) 영업사원이 제시한 상품과 프리젠테이션 만족도 별 상품 신청률을 확인하여 향후 영업과 마케팅에 활용이 가능
2. 시각화 과정 소개:
1) 영업사원과 관련된 feature들만 따로 모아 df 분리
2) 추천 상품별 신청/미신청 건수를 그래프로 그림
3) 추천 제품에 대한 소비자들의 영업 만족도를 구분하여 신청률을 그래프로 표현
4) 평균선을 추가하여 전체 평균과 비교 가능하도록 표현
3. 피드백:
1) 색깔이랑 스타일 등이 조금 더 심미적인 그래프가 되도록 그릴 필요가 있음
Graph2-1) 추천 상품별 신청/미신청(ProdTaken) 건수
# 영업사원과 관련된 컬럼만 가져와 df 분리
pitch_list = ['DurationOfPitch', 'NumberOfFollowups', 'ProductPitched', 'PitchSatisfactionScore', 'ProdTaken']
pitch_df = df[pitch_list]
pitch_df.head(3)
plt.figure(figsize=(8,6))
sns.countplot(x="ProductPitched", hue="ProdTaken", data=pitch_df)
plt.title('<추천 상품별 신청/미신청 건수>')
plt.show()

Graph2-2) 상품의 프리젠테이션 만족도별 신청률
pd.DataFrame(pitch_df.groupby(['ProductPitched', 'PitchSatisfactionScore'])['ProdTaken'].mean().unstack())
# pd.DataFrame(pitch_df.pivot_table('ProdTaken', index = 'ProductPitched', columns = 'PitchSatisfactionScore'))
#평균선을 그리기 위한 평균값 구하기
mean_taken = np.round(pitch_df['ProdTaken'].mean(), 3)

plt.figure(figsize=(12,6))
sns.catplot(x = 'ProductPitched', hue = 'PitchSatisfactionScore', legend=False,
            y = 'ProdTaken', kind= 'bar', data = pitch_df, height = 7, aspect=2)

plt.axhline(mean_taken, label='평균', linestyle = '--', linewidth = 3, color = 'r') ## 평균값을 y좌표로 하는 수평선 생성
plt.text(4, mean_taken + 0.01, f'평균값 : {mean_taken}', fontsize=25, fontweight = 'semibold') ## 평균에 대한 텍스트 출력

plt.legend(title='PitchSatisfactionScore', loc='upper right', fontsize = 15)
plt.xlabel('추천 상품', fontsize=16);
plt.ylabel('신청률', fontsize=16);
plt.title('<추천 상품 & 만족도 별 신청률>', fontsize=20)
plt.tick_params(axis='both', which='major', labelsize=14)
plt.show()

Graph3) 연령대별 패키지 여행 신청(ProdTaken) 비율
1. 시각화 목적:
1) 각 연령대별로 패키지 여행을 얼마나 신청했는지 그 비율을 그래프로 표현
2) 신청율이 떨어지는 연령대에 대해 추가적인 마케팅과 영업을 통해 성공율을 높일 수 있을 것으로 기대
2. 시각화 과정 소개:
1) '연령대(Ageband)'와 '신청 여부('ProdTaken)'간 cross_tab_prop 테이블 생성
2) 테이블을 horizontal bar plot으로 전체 100% 기준 비율 그래프로 변환
3) 그래프의 각 비율에 몇 퍼센트인지 텍스트를 첨가
3. 피드백:
1) 'ProdTaken'에서 0은 미신청이고 1이 신청인데 그래프를 보게 되면 0에 색깔이 부여되어 미신청이 마치 신청인 것처럼 보이게 됨
2) 0과 1의 순서를 바꾸어 줄 필요가 있음
cross_tab = pd.crosstab(index=df['Ageband'],
                        columns=df['ProdTaken'],
                        normalize= False)

cross_tab_prop = pd.crosstab(index=df['Ageband'],
                             columns=df['ProdTaken'],
                             normalize= 'index')
cross_tab_prop

cross_tab_prop.plot(kind='barh',
                        stacked=True,
                        colormap='Pastel1',
                        figsize=(10, 6))

plt.legend(loc="lower right", ncol=3)
plt.ylabel("연령", fontsize= 'large')
plt.xlabel("신청 비율", fontsize= 'large')
plt.title('<연령대별 신청율 차이>', fontsize= 'xx-large', fontweight= 'bold')


for n, x in enumerate([*cross_tab.index.values]):
    for (proportion, count, y_loc) in zip(cross_tab_prop.loc[x],
                                          cross_tab.loc[x],
                                          cross_tab_prop.loc[x].cumsum()):

        plt.text(x=(y_loc - proportion) + (proportion * 1/4),
                 y=n - 0.11,
                 s=f'{count} ({np.round(proportion * 100, 1)}%)',
                 color="Black",
                 fontsize=10,
                 fontweight="normal")

plt.show()

ㄴㅇㄹㄴㅇㄹ
'BACS > 정규세션' 카테고리의 다른 글
| [BACS] 정규 세션 2주차 Tourism 시각화 (1) (0) | 2022.11.18 |
|---|---|
| [BACS] 정규 세션 2주차 Titanic 시각화 (2) (0) | 2022.11.04 |
| [BACS] 정규 세션 2주차 Titanic 시각화 (1) (0) | 2022.10.14 |
| [BACS] 정규 세션 1주차 (강원도 소방 데이터) (0) | 2022.09.30 |
| [BACS] 정규 세션 1주차 (Pandas 실습 - World2012) (0) | 2022.09.27 |